Nasdaq in Limbo

The Nasdaq 100 has been going sideways now for over a month, while the other markets Dow, SP, and Russell have been trending upward (at least till the end of Jan).  Look at this hourly chart of the NDX.  Simply buying around 2725 and selling around 2745 you would have Read More
A very possible bearish scenerio

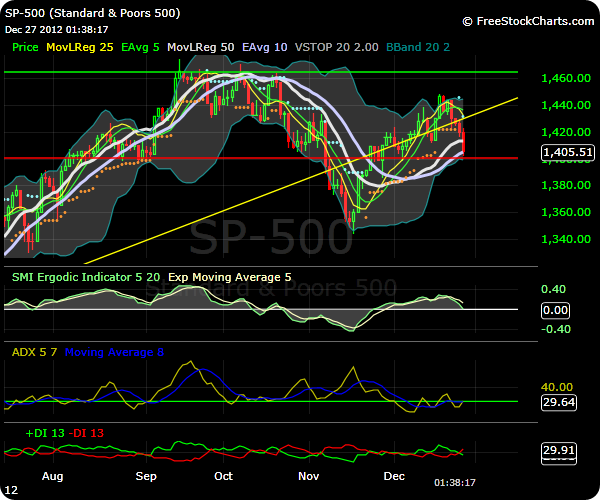
I found this chart on Zerohedge today and was amazed at its symmetry and the likelihood of it playing out.  However, I think the SP could drop to even lower than 1100.  It is way overdue.

Apple’s bear move

Apple has had a tremendous, parabolic rise followed by a huge drop from 705 to 435, over 38% drop in price, in market value.  Wow!   But after such a meteoric rise what would one expect.  (Interesting that 38% is a Fibonacci number.)  Here is the daily chart first.  Strong downtrend Read More

Market Indexes at 2/1/13

Dow: On a long-term basis looking at the monthly charts .. all is bullish, with a couple of caveats.  Its nearing the previous high of 14,198 but has yet to take it out.  The ADX is not showing a strong trend, as compared to say 06,07,08 since it’s under 30.  Read More

SP 500 at 1/18/13

The S&P appears to be on its way toward 1576, the high in 2007. Looking at the daily and weekly charts, everything is pointed up and now that it took out resistance at the Sept. 2012 highs, and the debt ceiling issue has been put off for 3 months, or Read More