SPY Sept 2015

End of the bull market?

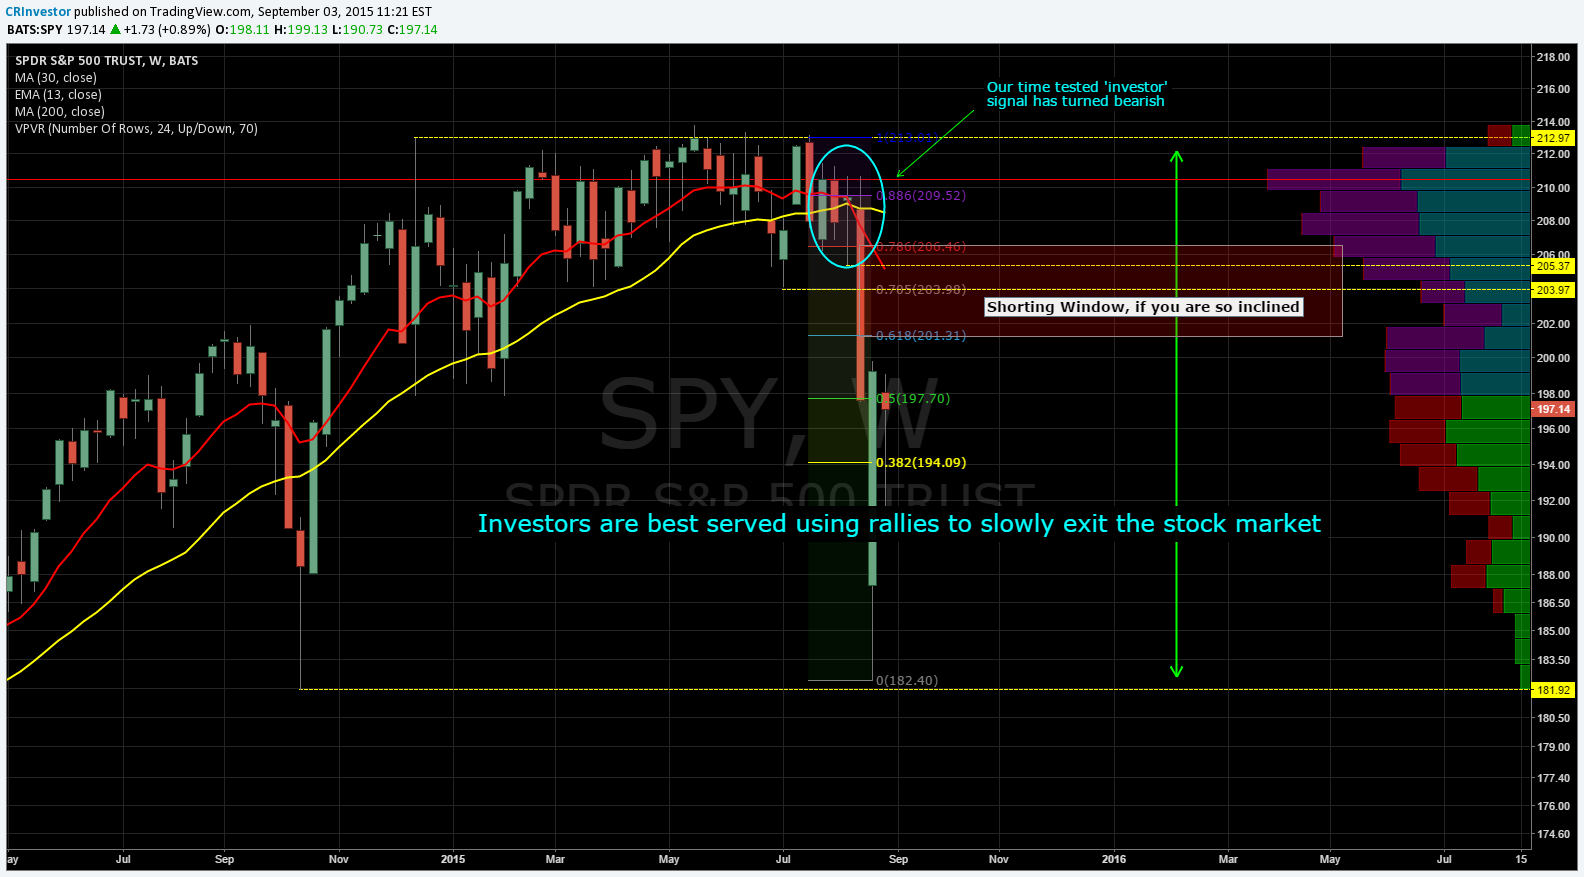
In August, in fact the week ended 8/21/2015, the market made a significant turn.  The weekly indicators (moving averages, linear regression curves) turned bearish for the first time since 7/2011. The Dow downside targets are 14,500-13,700 or as low as 11,000 S&P  downside target 1560-1400 The SPY is the ETF Read More
ERX

Has Oil Bottomed?

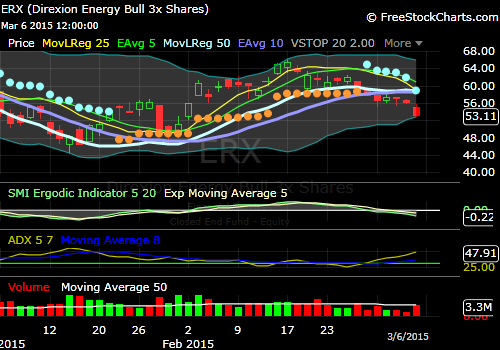
Since everyone is watching the great gas prices of January, disappear I thought I would put up a chart on oil futures. My wife noted that she paid 2.19/gal for gas in January while now it is at 3.29 here in Colfax, CA. The downswing in oil has brought the Read More

Nasdaq 100 correction ahead

Nasdaq 100 due for correction

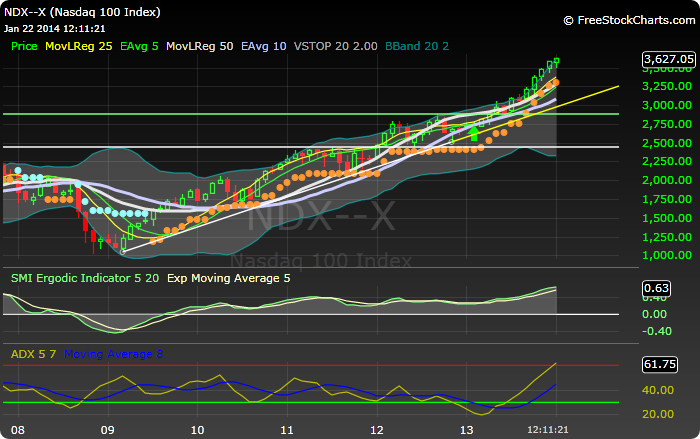
The Nasdaq 100 has gone from 1040 to over 3600 since 3/09, just less than 5 years. Looking at the monthly chart, the ADX shows it’s in dangerous territory, overbought and due for a correction. But before taking profits or shorting I would be looking for the ADX to cut Read More

New Highs (again) on the S&P. Will it ever end?

The S&P continued toward my target in the 1600 area, in fact I believe it hit the 1.618 Fibonacci move today and could retrace from here.  Several indicators of that possibility.  It is way beyond its upper Bollinger Band, it is possibly forming its third bearish divergence against the Ergodic Read More

Tags:

Other Stock Indexes Lagging the Dow

Even though the Dow has made new highs, and looks quite strong here at around 14,300, the S&P still has to exceed 1576 to take out its highs and its just at 1541.  This lack of confirmation by the other indices is a bit of a warning not to be Read More

VIX Market Buy Signal

Yesterday gave a confirmed VIX buy signal.  The last four of these signals have delivered the goods, however, the last confirmed sell signal took two weeks before a dip and that wasnt even to the level of when it occurred.  The chart below is courtesy of Springheel Jack.

Directionless Market Makes one Crazy!

Well two up days in a row seem to have voided the big drop on Monday (2/25) however this all seems to be a normal pull back to the 50/10 LRC lines and the volatility stops.  On the Nasdaq 100 the 50/10 have crossed under bearish and the 25/5 is Read More

Bearish indication of last week coming true

Last week I posted that the Russell 2000 was foretelling of an upcoming bear move. Generally small caps lead the way. After a bounce Friday to the 50/10 LRCs and giving the 25/5s time to cross below the 50/10s, the market is now resumed its down move. There was a Read More

Russell 2000 daily chart

Russell Giving Bearish Warning

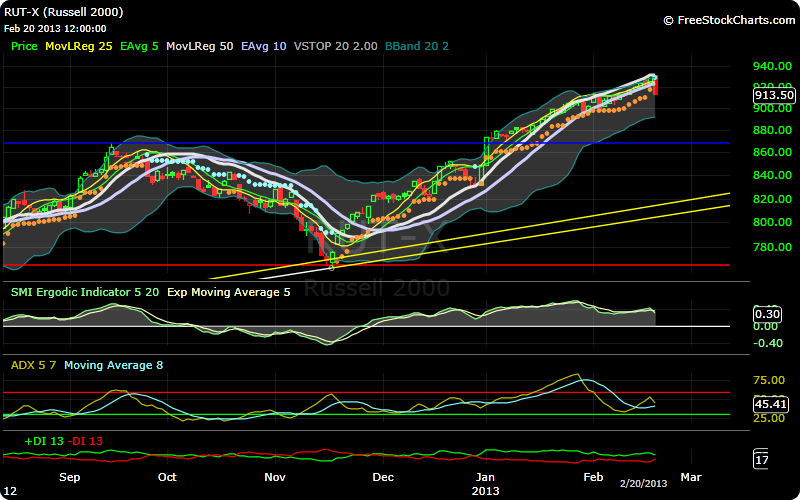
Quite a reversal today with the Nasdaq 100 down 1.5% and the Russell 2000 (RUT – small caps) down almost 2%.  Looking at the daily chart the RUT sliced through the 50/10 LRC and actually took out the volatility stop.  The S&P, Dow, and Nasdaq stopped right above their Volatility Read More