Directionless Market Makes one Crazy!

Well two up days in a row seem to have voided the big drop on Monday (2/25) however this all seems to be a normal pull back to the 50/10 LRC lines and the volatility stops.  On the Nasdaq 100 the 50/10 have crossed under bearish and the 25/5 is Read More
Bearish indication of last week coming true

Last week I posted that the Russell 2000 was foretelling of an upcoming bear move. Generally small caps lead the way. After a bounce Friday to the 50/10 LRCs and giving the 25/5s time to cross below the 50/10s, the market is now resumed its down move. There was a Read More

Russell 2000 daily chart

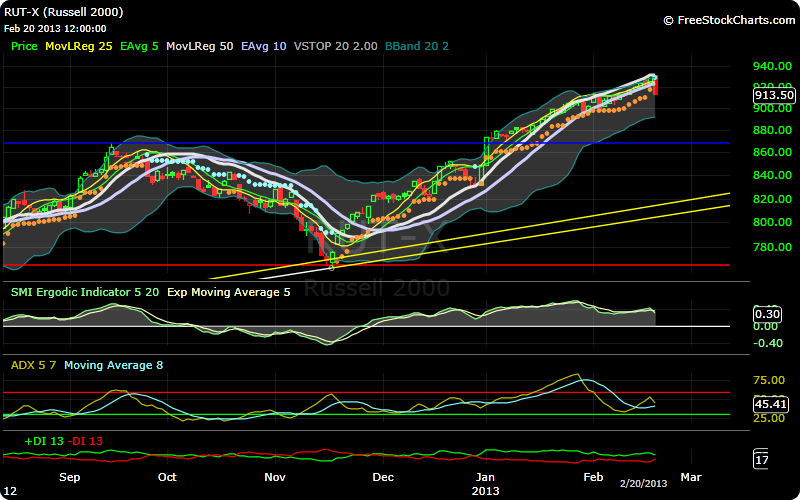
Russell Giving Bearish Warning

Quite a reversal today with the Nasdaq 100 down 1.5% and the Russell 2000 (RUT – small caps) down almost 2%.  Looking at the daily chart the RUT sliced through the 50/10 LRC and actually took out the volatility stop.  The S&P, Dow, and Nasdaq stopped right above their Volatility Read More

Nasdaq in Limbo

The Nasdaq 100 has been going sideways now for over a month, while the other markets Dow, SP, and Russell have been trending upward (at least till the end of Jan).  Look at this hourly chart of the NDX.  Simply buying around 2725 and selling around 2745 you would have Read More

A very possible bearish scenerio

I found this chart on Zerohedge today and was amazed at its symmetry and the likelihood of it playing out.  However, I think the SP could drop to even lower than 1100.  It is way overdue.

Apple’s bear move

Apple has had a tremendous, parabolic rise followed by a huge drop from 705 to 435, over 38% drop in price, in market value.  Wow!   But after such a meteoric rise what would one expect.  (Interesting that 38% is a Fibonacci number.)  Here is the daily chart first.  Strong downtrend Read More

Market Indexes at 2/1/13

Dow: On a long-term basis looking at the monthly charts .. all is bullish, with a couple of caveats.  Its nearing the previous high of 14,198 but has yet to take it out.  The ADX is not showing a strong trend, as compared to say 06,07,08 since it’s under 30.  Read More

Apple vs. Amazon

This is great!  The comparison of financial stats on Apple vs. Amazon.  Go thru the graphic below, starting at the top until you get to the bottom and most likely your response will be WTF!!??  The markets’ reactions are so often a surprise.

Jan 29, 2013 Consumer Confidence drop

The Conference board reported that consumer confidence in January dropped to lowest level since Nov. 2011. I find this interesting in light of the stock market nearing its all time high (S&P high was 1576 in 2007). Also in light of the rising retail sales numbers. Maybe fear brings about Read More

Nasdaq forming H&S??

On a weekly basis the Nasdaq 100 could be forming a Head and shoulders pattern.  It could easily still rise to 2800 (the old up trend line) and then sell off.  Key is the break of the neckline or a break above the September high.